In August 2022, many areas of central Europe experienced drought conditions. Very high temperatures for the season and extremely low precipitation for a long period of time led to significant changes in the broader landscape: lakes and reservoirs with decreased water levels and rivers with a considerable drop in flows. These phenomena have a negative impact on the primary productive sector, agriculture. Significant areas that in other years were in full bloom seemed to have been affected by the drought in the wider region.
Satellite imagery can be used to monitor such changes in land cover and extract meaningful insights over specific areas of interest (AOIs). Cloudeo exploited the high-resolution imagery of Copernicus Sentinel-2 (10m pixel size) from Sentinel Hub, to calculate the above-mentioned change in water areas and cultivated lands.
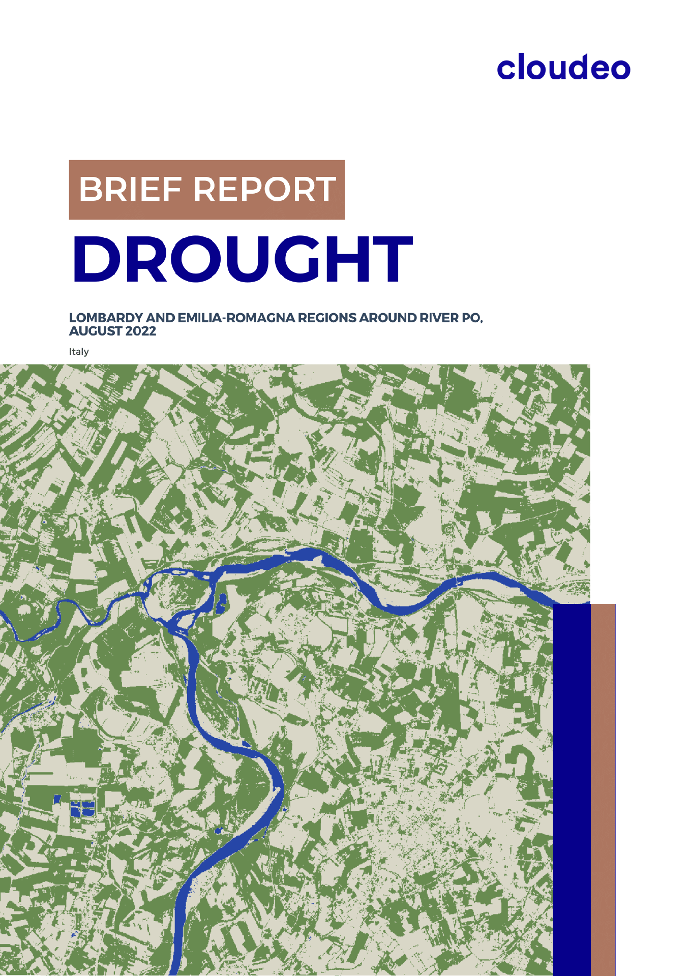
The selected AOI is located between Lombardy and Emilia-Romagna regions around river Po, Italy, with a total area of 412 square kilometers. The total affected area of the AOI due to the drought is estimated to have affected 236,7 sq. km of croplands and water areas, or approximately 57,4% of the selected region, compared to data in the same area over the past 3 years.
Satellite imagery
For the drought mapping, Sentinel-2 imagery was used; its sensor includes the Red and Near-Infrared bands which help in the classification process of extracting vegetated and water areas. Furthermore, its 10-meter spatial resolution is ideal and cost-effective for event monitoring covering large areas, like in a drought situation. Furthermore, its 10-meter spatial resolution is ideal and cost-effective for event monitoring covering large areas, like in a drought situation.
In order to calculate and evaluate this year's disaster over the cultivated areas of the selected region, satellite imagery from the past three years was retrieved and used for visualization and analytics generation.
The Sentinel-2 acquisition dates used in this analysis are the following:
16-08-2022 (Sentinel-2A)
14-08-2021 (Sentinel-2A)
11-08-2020 (Sentinel-2B)
27-08-2019 (Sentinel-2B)
Insights extraction
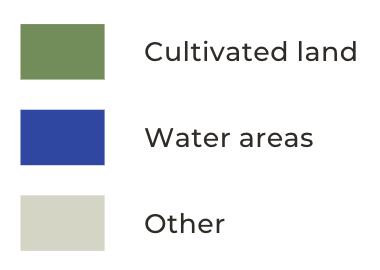
For each year, the Normalized Difference Vegetation Index (NDVI) was calculated. This analysis focuses on cultivated land and water areas, so after some further analysis, the vegetated areas, as well as areas covered with water were generated.
Drought impact
Time-series analysis can indicate the level of impact caused by a severe environmental phenomenon, such as droughts. The following graphs present the fluctuation of cultivated land and water areas from 2019 to 2022 that covered the AOI.
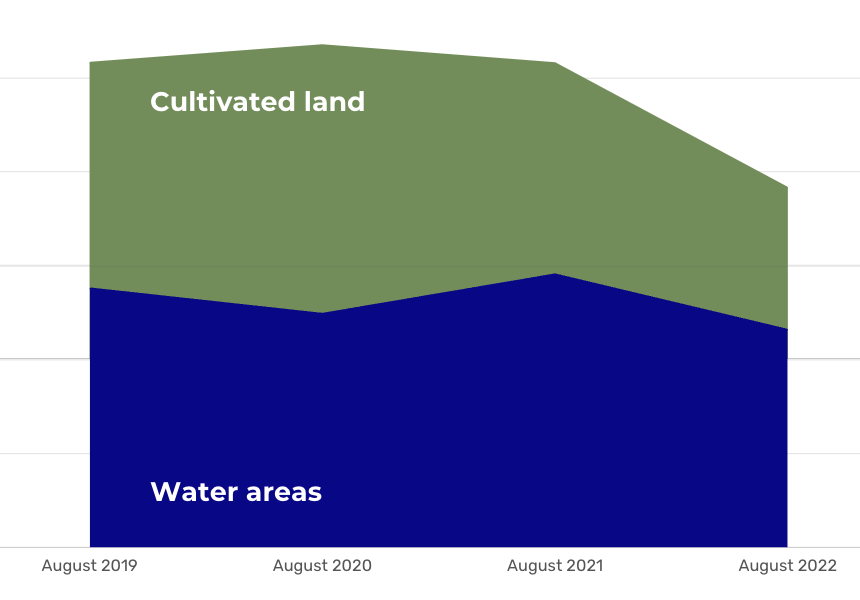
The mean values of the drop with reference year the year of 2022 can indicate the level of the drought impact over the AOI. More specifically, due to drought, as of 16/8/2022 there is:
- 43,1% of less cultivated areas, which also means a high loss in crop yield
- 14,3% of less water coverage
Get access to the full report of the Drought Impact over Lombardy and Emilia-Romagna regions around river Po, and discover how you can take advantage of high-resolution satellite imagery, like Copernicus Sentinel-2, to gain valuable insights for the Agricultural and Water Management sectors: