It has been one of the world's worst floods since the floods in South Asia in 2020 and characterized as the worst in the country's history declared as a flood emergency. Pakistan was hit by heavy monsoon rains and melting glaciers following a severe heat wave, all of which contributed to this extreme event strongly related to climate change. Flooding has washed away buildings, infrastructure, crops, and livestock from hilly places to plains, causing the Pakistani government to predict damages of US$40 billion.
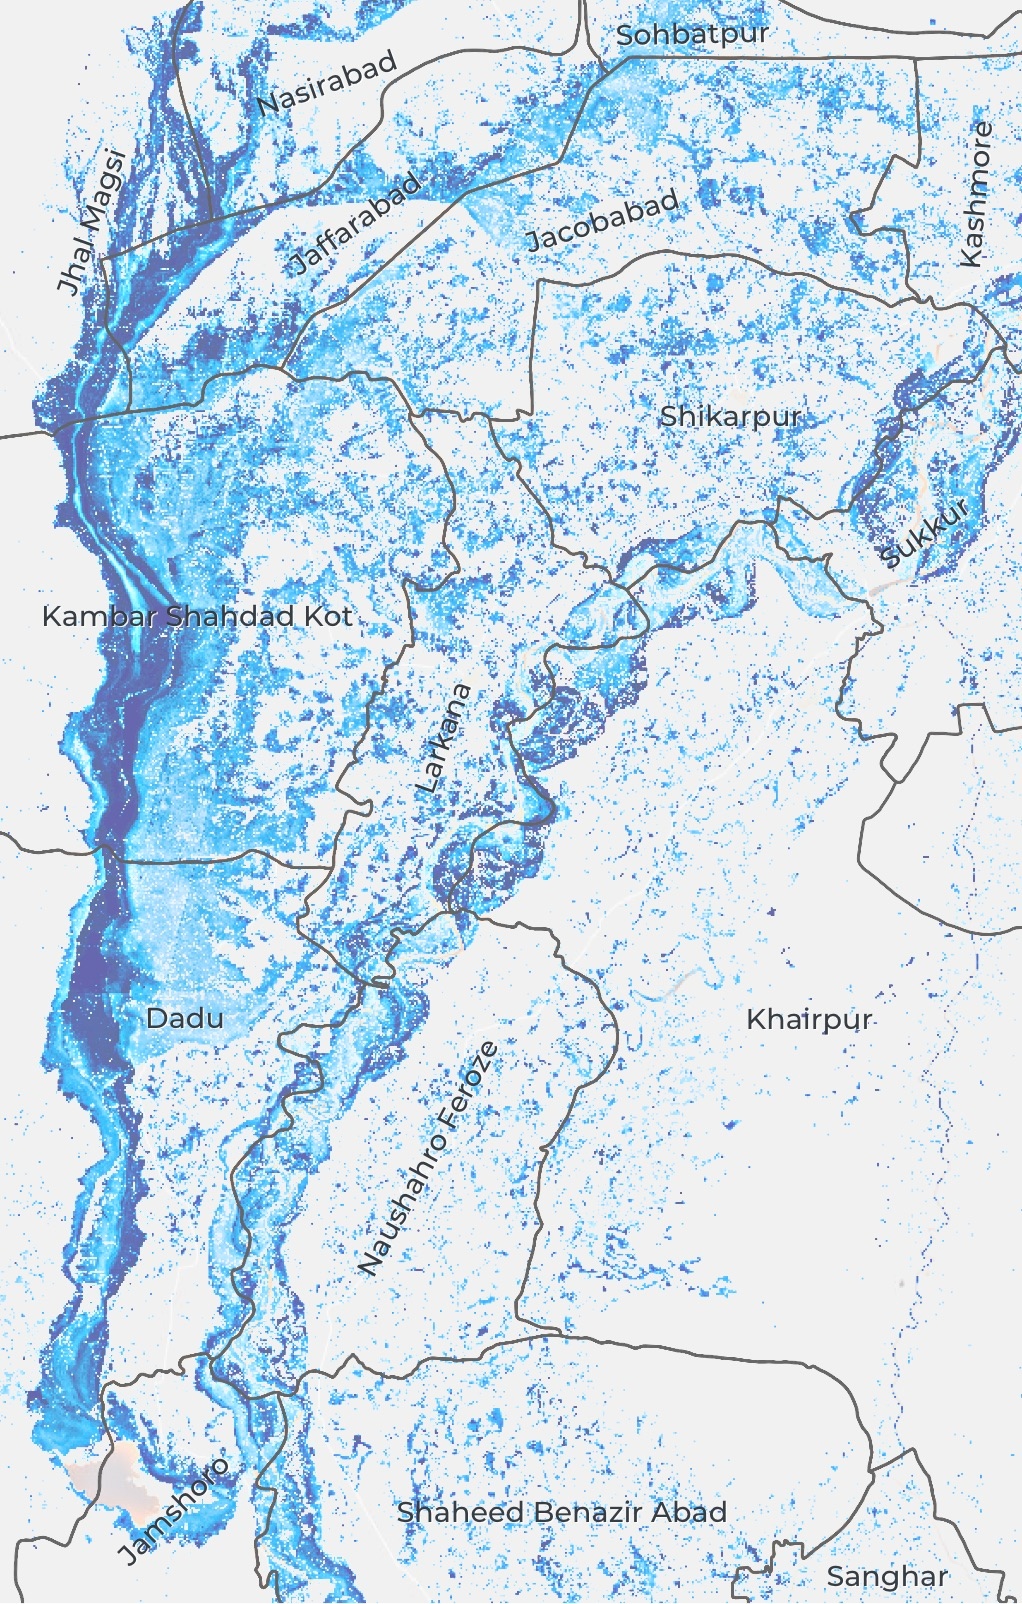
The study area covers parts of Balochistan and Sindh provinces, with the largest coverage on the latter. The analysis uses high-resolution satellite imagery for the mapping of the flood, and ancillary geospatial datasets (Land Use / Land Cover and Buildings located within the area) to support the findings.* As for the satellite imagery, Copernicus Sentinel 2 images were used in order to extract the areas covered with water.
Satellite imagery can be used to monitor changes in land cover and extract meaningful insights over specific areas of interest (AOIs). Cloudeo exploited the high-resolution imagery of Copernicus Sentinel-2 (10m pixel size), available through Sentinel Hub, to estimate the level of impact of this devastating flood event.
Flood impact
As of September 3rd, a total of 12,768 square kilometers were covered by water within the area of interest. Of this area, 70% were croplands, and a total of 5115 and 60135 buildings were affected within the province of Balochistan and Sindh respectively.
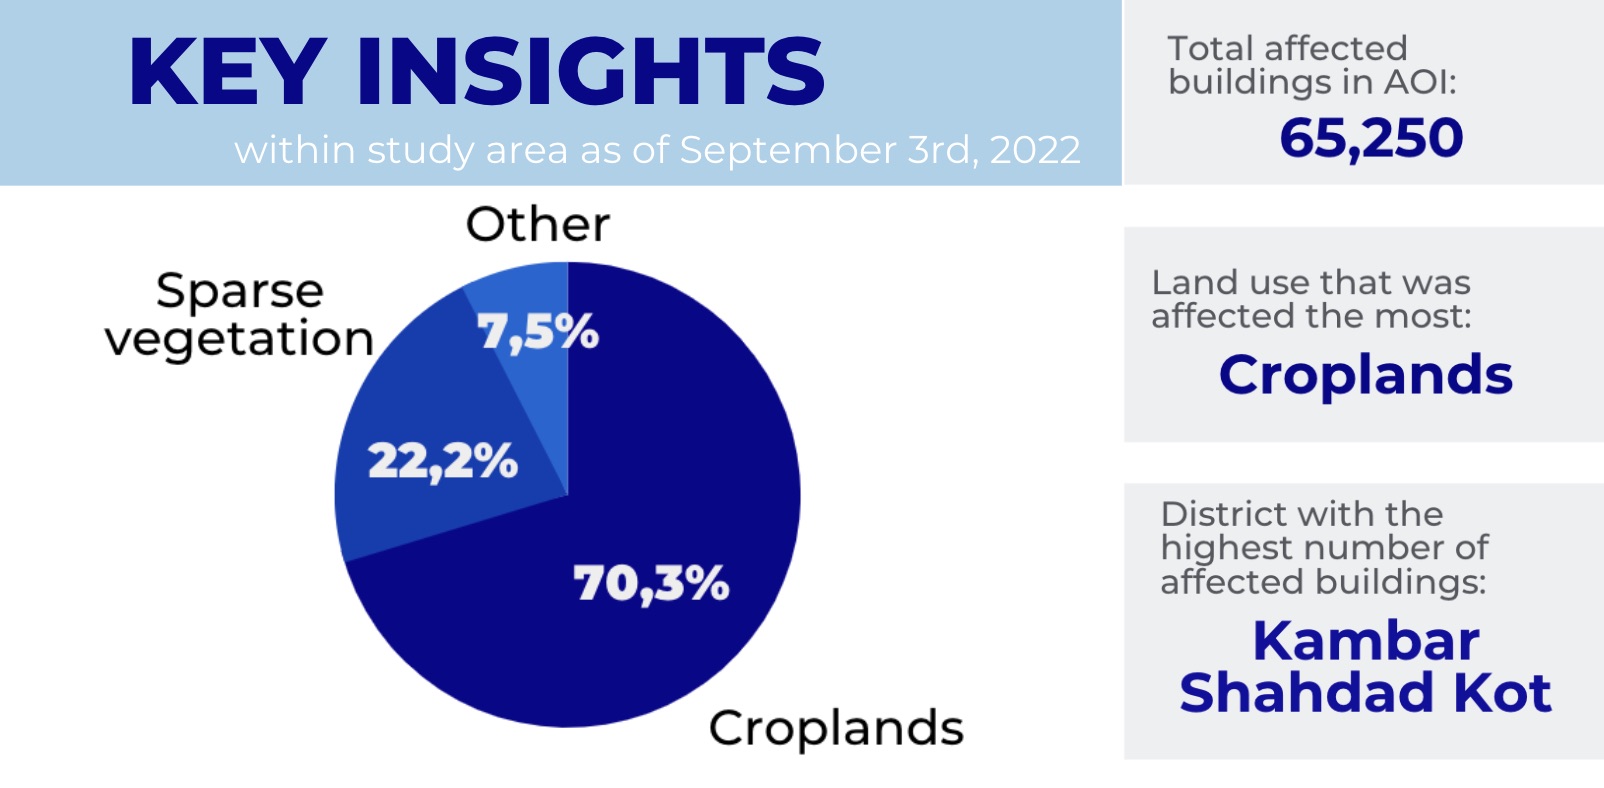
Specifically, due to this extreme flood event, over the AOI as of 3/9/2022 there were:
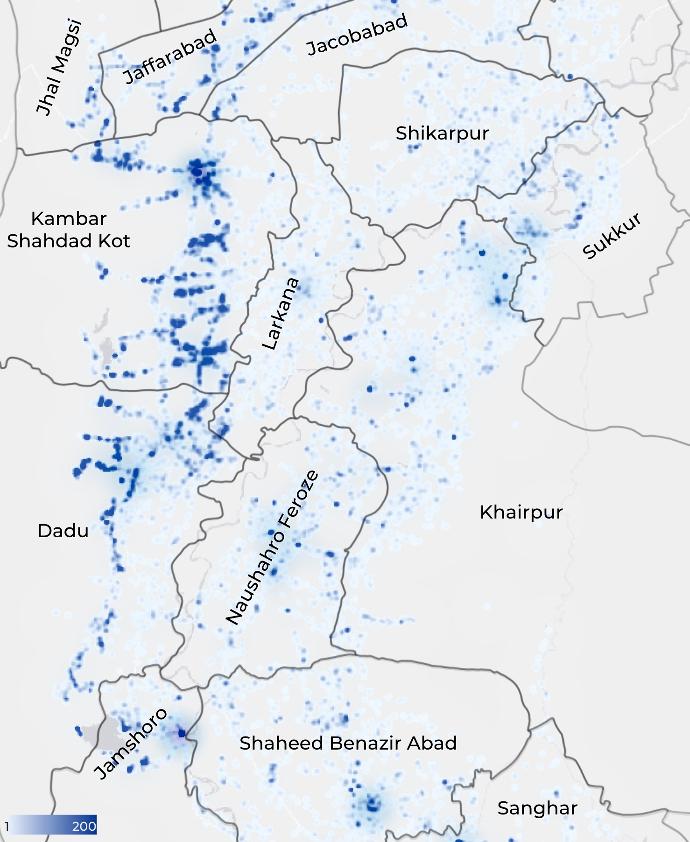
more than 10,000 affected buildings in Kambar Shahdad Kot and Khairpur districts,
between 5,000 and 10,000 affected buildings in Dadu, Naushahro Feroze, and Shaheed Benazir Abad districts,
between 1,000 and 5,000 affected buildings in Jamshoro, Jaffarabad, Sukkur, Larkana, Jacobabad, Shikarpur, and Sanghar districts, and
less than 1,000 affected buildings in the districts of Sohbatpur, Jhal Magsi, Kashmore, Nasirabad, and Nasirabad.
The density of the affected buildings by the flood event as of September 3rd is presented in the following figure:
Satellite imagery combined with relevant geospatial data can indicate the level of impact caused by a severe environmental phenomenon, such as floods. With the proper analytical methodology, meaningful insights can be retrieved, not only for damage assessment and monitoring of such devastating events but also as support in the humanitarian efforts performed worldwide.
Download the Brief Report of the Flood Impact over Balochistan and Sindh provinces around Indus River, and discover how you can take advantage of high-resolution satellite imagery, like Copernicus Sentinel-2, to gain valuable insights for the Natural Hazard Assessment and Human Crisis: